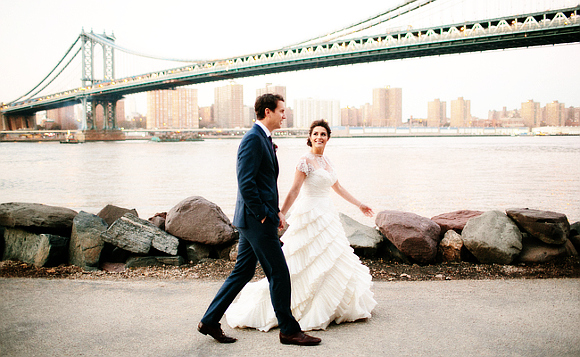
Getting Married: Get Your Smartphone!
Couples are focusing on creating an amazing guest experience and reception details, including finding unique venues

The Knot, the #1 multiplatform wedding resource, today released the results of The Knot 2014 Real Weddings Study. The eighth annual comprehensive report, the largest of its kind, surveyed nearly 16,000 US brides and grooms married in 2014 to uncover the financial spending habits and trends of real weddings in America. This study includes national and regional statistics on the average cost of a wedding, how it is budgeted, the average number of wedding guests, spend per guest, wedding style trends and other key statistics related to weddings in America.
«While wedding budgets continue to rise, with the national average at $31,213, guest lists are shrinking. The average wedding now has 136 guests, down from 149 in 2009″, said Rebecca Dolgin, Editor in Chief of The Knot. «Couples are focusing on creating an amazing guest experience and reception details, including finding unique venues to reflect their personality. Perhaps the biggest change we’ve seen is in the amount of brides using their mobile phone to plan their wedding—it has doubled in just three years.»
New York City (Manhattan) and Long Island have the highest average wedding spend ($76,328 and $55,327, respectively), and Arkansas and Utah had the lowest average wedding spend ($18,031 and $15,257, respectively), excluding honeymoon.
Top 2014 Wedding Statistics
- Average Wedding Cost: $31,213 (excludes honeymoon)
- Most Expensive Place to Get Married: Manhattan, $76,328 average spend
- Least Expensive Place to Get Married: Utah, $15,257 average spend
- Average Spent on a Wedding Dress: $1,357
- Average Marrying Age: Bride, 29; Groom, 31
- Average Number of Guests: 136
- Average Number of Bridesmaids: 4 to 5
- Average Number of Groomsmen: 4 to 5
- Most Popular Month to Get Engaged: December (16%)
- Average Length of Engagement: 14 months
- Most Popular Month to Get Married: June (15%) followed by October (14%)
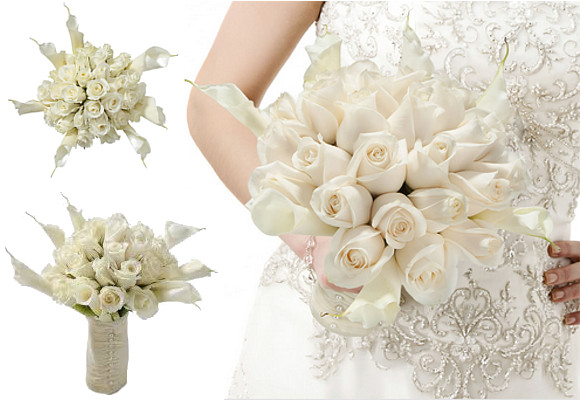
- Popular Wedding Colors: Ivory/White (44%), Blue (37%), Pink (28%), Metallics (26%), Purple (23%)
- Dark blue specifically has continued to grow every year, from 10% in 2008 to 24% in 2014
- Percentage of Destination Weddings: 24%
Using Smartphones for planning: Couples are researching everything from gowns to vendors on mobile applications. In 2014, the use of smartphones to access wedding planning websites has nearly doubled from 2011 (33%) to 2014 (61%). In fact, 71% of couples accessed TheKnot.com from their smartphones. About 6 out of 10 brides are actively planning their weddings through their mobile device: researching gowns on smartphones (61%), up from 27% in 2011; researching wedding vendors on mobile (57%), up from 22% in 2011.
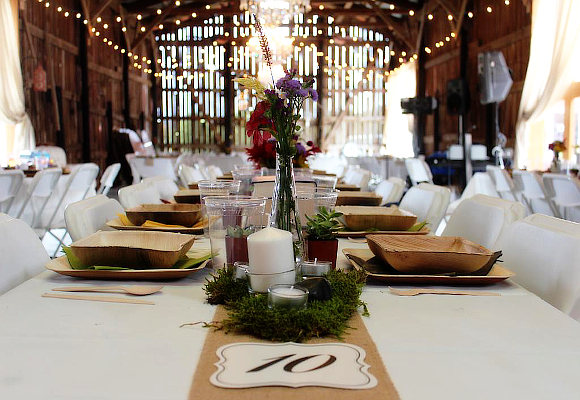
Personalitation is on the rise, including changes in venues: Couples are showing their unique style by choosing unexpected places to wed. Since 2009, historic buildings/homes and farm venues have grown in popularity. Historic buildings/homes make up 14% in 2014, compared with only 12% in 2009, and farms make up 6% in 2014, up from 3% in 2009. While banquet halls (22%), country clubs (11%) and hotels (11%) are still popular options for couples, about 40% are looking for unusual venues that better reflect their personality.
Couples are spending more on their reception elements, and less on their ceremony: Spending is on the rise across reception categories, and couples are spending more on their catering, musicians and cake in 2014. Spending for cocktail hours also rose to 76% from 69% in 2010. Couples are spending less on the ceremony. In 2014, 33% of couples hired pianists and organists for their ceremony, down from 49% in 2009, and 28% of couples held their ceremony in a religious institution, down from 41% in 2009. On average, the bride’s parents contribute 43%, the bride and groom contribute 43%, and the groom’s parents contribute 12% of the total wedding budget (others account for the remaining 2%). Only 12% of couples pay for the wedding entirely themselves.
In 2014, 45% of couples went over budget, about 1 in 4 (26%) of couples stayed within their budget, and only 6% of couples came out under budget. 23% didn’t even have a wedding budget, up from 17% in 2009.
Busy lives means saving the date: More couples are using save-the-dates. The percentage of couples who used save-the-dates was 75% in 2014, compared with 72% in 2013 and 57% in 2009. In 2014, 50% of couples had their save-the-dates professionally made, up from 29% in 2009.
Based on average cost of a wedding in 2014, couples spend the most on their weddings in the following areas in the US. Five of the six most expensive areas to get married are in the New York/Tri-State area. The Knot is the flagship brand of XO Group Inc.(NYSE: XOXO), the premier consumer internet and media company dedicated to guiding people through transformative life stages – from getting married, moving in together and having a baby.